What is 'Low Volatility' Investing?
As on February 20, 2022 the batsman with the best strike rate in men’s one day internationals is Andre Russell of the West Indies scoring 130.22 runs for every 100 balls faced. He is followed by Glen Maxwell of Australia (125.43) and Jos Buttler of England (118.66) (ESPN Sports Media, 2022a).
Fast scoring and exciting as they most certainly are, these same players are nowhere close to the top ranked when it comes to consistency, which is signified by career batting averages. Russell and Maxwell don’t even make it to the top 100 with Buttler sneaking in at 95th rank with career batting averages of 27, 34 and 39 respectively (ESPN Sports Media, 2022b).
While every team needs fast scorers, the foundation for its performance is often provided by those who provide the highest consistency; the kind provided by a Virat Kohli and Michael Bevan with career averages of 58 and 53 (ESPN Sports Media, 2019), respectively (ESPN Sports Media, 2022b).
How does this kind of consistency relate to the world of investing? In investing, avoiding large losses can be far more important than making big profits. Investment success can be achieved by being consistently right even if it means that the gains from each investment are not the highest. Low volatility stocks offer this consistency to a portfolio.
The low volatility factor targets securities with lower volatility characteristics. This typically translates into generally more consistent returns with lower deviations from long term means.
Several studies, including those conducted by Haugen and Heins (Haugen & Heins, 1972) as well as Frazzini (Frazzini & Pedersen, 2014), have demonstrated the existence of the Low Volatility Effect with empirical evidence of the ability of low volatility stocks to generate better risk-adjusted returns versus high volatility stocks on average, in US, European as well as emerging markets.
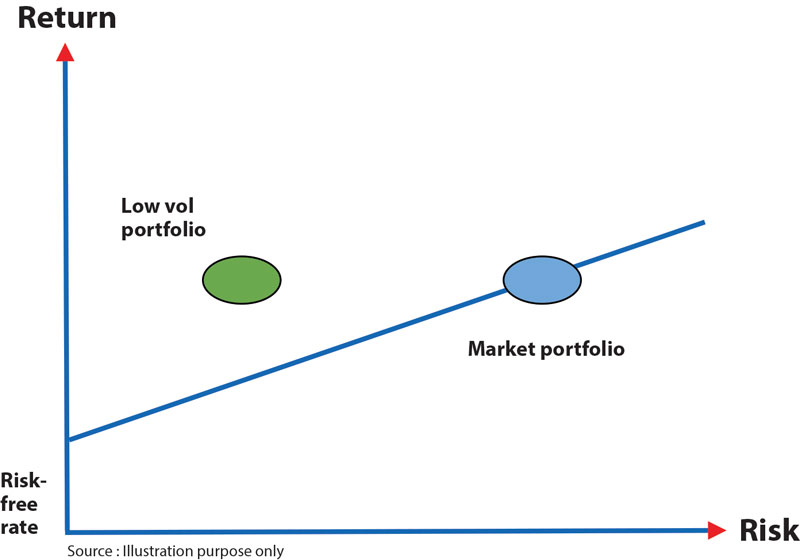
Also, many institutional and some retail investors deploy low volatility strategies to lower portfolio risk. The diagram below depicts how low volatility stocks can move the risk-return positioning of a portfolio to a superior position.
Volatility is usually measured using common statistical tools like standard deviation and semivariance. Like momentum, it offers vast choices in the period for which and over which it is computed, the holding period and whether one uses a single period of analysis or multiple ones.