Performance of Select Value Parameters
A.Dividend Yield
- Dividend Yield is calculated by taking the Trailing Twelve Months (TTM) Dividend Paid and dividing it by the closing price of the stock. This financial ratio provides investors with an indication of the annual dividends paid relative to the market value of the stock.
- Example:
TTM Dividend Paid: Rs.15 per share (Trailing Twelve Months - sum of the last four quarterly dividends)
Closing Price: Rs.1200 per share
- Calculation:
Dividend Yield = (TTM Dividend Paid / Closing Price) * 100%
Dividend Yield = (Rs.15 / Rs.1200) * 100%
Dividend Yield = 1.25%
This means that for every Rs.100 invested in the stock, the investor earns an income of Rs.1.25 annually in the form of dividends.
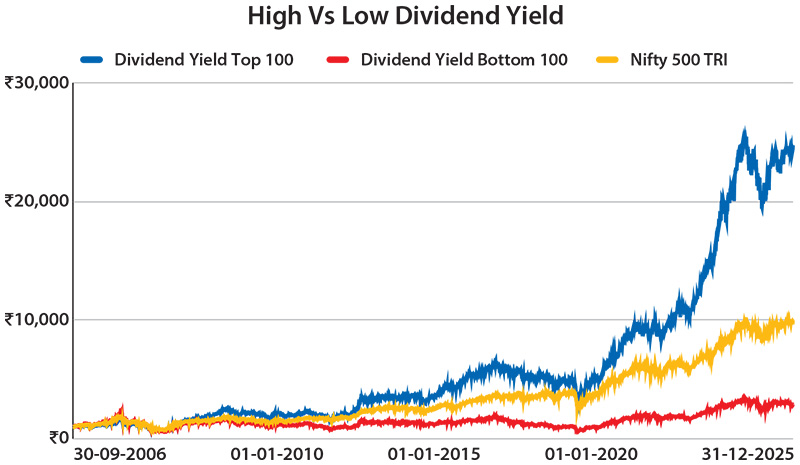
| From Sep 2006 to Dec 2025 |
CAGR (%) |
10 Year Median
Rolling Returns (%) |
Annualised
Volatility (%) |
Maximum
Drawdown (%) |
Cumulative
Growth of Rs.1000 |
| Dividend Yield Top 100 |
18.12 |
17.38 |
20.60 |
-67.08 |
Rs.24,768 |
| Dividend Yield Bottom 100 |
5.63 |
4.08 |
23.77 |
-78.02 |
Rs.2,873 |
| Nifty 500 TRI |
12.65 |
13.54 |
19.88 |
-63.71 |
Rs.9,929 |
Source: CMIE, NJ’s Smart Beta Platform. Data is for the period 30th September 2006 to 31st December 2025. Past performance may or may not be sustained in future and is not indication of future return.
B.Price-to-Earnings (P/E)
- This ratio is calculated by dividing the current market price of a stock by its Earnings Per Share (EPS). This financial ratio helps investors evaluate the relative valuation of a stock by comparing the price investors are willing to pay for each unit of earnings generated by the company. The P/E ratio can be calculated either by using trailing earnings i.e. historical earnings or by using forward or forecasted earnings based on the investors’ expectations.
- Example:
Market Price per Share: Rs.1200
Earnings Per Share (EPS): Rs.80
- Calculation:
P/E Ratio = Market Price per Share / EPS
P/E Ratio = Rs.1200 / Rs.80
P/E Ratio = 15
A P/E ratio of 15 means that investors are willing to pay Rs.15 for every Rs.1 of the company’s earnings.
| From Sep 2006 to Dec 2025 |
CAGR (%) |
10 Year Median
Rolling Returns (%) |
Annualised
Volatility (%) |
Maximum
Drawdown (%) |
Cumulative
Growth of Rs.1000 |
| Low Price to Earnings 100 |
16.96 |
15.10 |
23.45 |
-69.68 |
Rs.20,478 |
| High Price to Earnings 100 |
11.18 |
12.82 |
19.27 |
-72.30 |
Rs.7,713 |
| Nifty 500 TRI |
12.65 |
13.54 |
19.88 |
-63.71 |
Rs.9,929 |
Source: CMIE, NJ’s Smart Beta Platform. Data is for the period 30th September 2006 to 31st December 2025. Companies with negative earnings are not considered. Past performance may or may not be sustained in future and is not indication of future return.
C. Price-to-Book Value (P/BV)
- This ratio is calculated by dividing the current market price of a stock by its book value per share i.e. the value of its shareholders equity or net assets. The P/BV ratio helps investors determine whether a stock is overvalued or undervalued compared to the company’s net assets.
- Example:
Market Price per Share: Rs.500
Book Value per Share: Rs.250
- Calculation:
P/BV Ratio = Market Price per Share / Book Value per Share
P/BV Ratio = Rs.500 / Rs.250
P/BV Ratio = 2
A P/BV ratio of 2 indicates that investors are willing to pay Rs.2 for every Rs.1 of the company’s net assets.
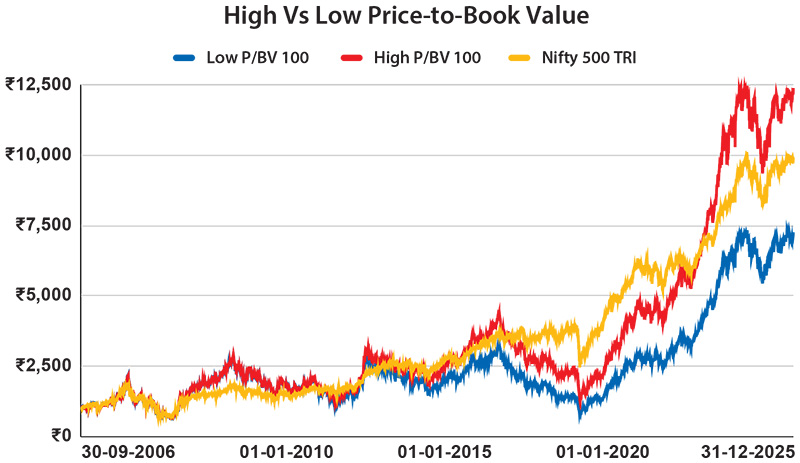
| From Sep 2006 to Dec 2025 |
CAGR (%) |
10 Year Median
Rolling Returns (%) |
Annualised
Volatility (%) |
Maximum
Drawdown (%) |
Cumulative
Growth of Rs.1000 |
| Low Price to Book Value 100 |
10.84 |
6.78 |
25.71 |
-74.39 |
Rs.7,264 |
| High Price to Book Value 100 |
13.96 |
10.80 |
24.84 |
-70.92 |
Rs.12,402 |
| Nifty 500 TRI |
12.65 |
13.54 |
19.88 |
-63.71 |
Rs.9,214 |
Source: CMIE, NJ’s Smart Beta Platform. Data is for the period 30th September 2006 to 31st December 2025. Companies with negative book value are not considered. Past performance may or may not be sustained in future and is not indication of future return.
D. Enterprise Value / Earnings Before Interest and Taxes (EV/EBIT)
- The EV/EBIT ratio is calculated by dividing the enterprise value (EV) of a company by its earnings before interest and taxes (EBIT). This ratio is used to assess a company’s valuation while considering both equity and debt.
- Example:
Enterprise Value (EV): Rs.2,40,000 crores
Earnings Before Interest and Taxes (EBIT): Rs.30,000 crores
- Calculation:
EV/EBIT = Enterprise Value / Earnings Before Interest and Taxes
EV/EBIT = Rs.2,40,000 crores / Rs.30,000 crores
EV/EBIT = 8
An EV/EBIT ratio of 8 means that investors are willing to pay Rs.8 for every Rs.1 of the company’s operating earnings before interest and taxes.
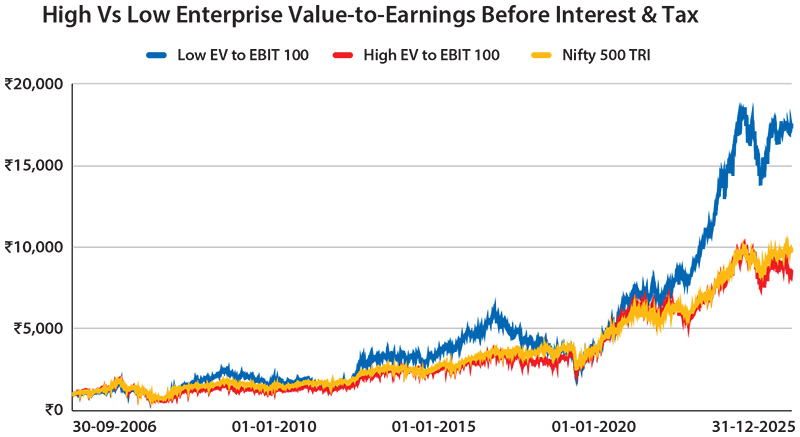
| From Sep 2006 to Dec 2024 |
CAGR (%) |
10 Year Median
Rolling Returns (%) |
Annualised
Volatility (%) |
Maximum
Drawdown (%) |
Cumulative
Growth of Rs.1000 |
| Low EV to EBIT 100 |
16.04 |
15.77 |
22.06 |
70.03 |
Rs.17,584 |
| High EV to EBIT 100 |
11.81 |
14.11 |
19.68 |
-73.40 |
Rs.8,587 |
| Nifty 500 TRI |
12.65 |
13.54 |
19.88 |
-63.71 |
Rs.9,929 |
Source: CMIE, NJ’s Smart Beta Platform. Data is for the period 30th September 2006 to 31st December 2025. Companies with negative EBIT and lending companies are not considered. Past performance may or may not be sustained in future and is not indication of future return.