NJ’s Value Factor - NJ Traditional Value & NJ Enhanced Value Models
A combination of good value parameters, portfolio diversification, and a robust weighting approach can assist in capturing the value factor to a large extent.
NJ Asset Management’s research shows that value characteristics are cyclical and may perform differently for different sectors. In addition, there are important differences in how value needs to be measured for financial and non-financial companies. There is also the additional challenge of avoiding value traps.
We’ve developed two distinct value indices: one adheres to the traditional relative value concept, while the other is an enhanced version that employs intrinsic value to categorise value stocks within the universe. To further advance our approach, we have refined both methodologies, incorporating deeper valuation insights to improve stock selection.
The NJ Enhanced Value model adopts a Discounted Cash Flow (DCF) approach to estimate the intrinsic value of companies and identify potential mispricing. By assessing whether a stock is trading below its intrinsic worth, this methodology seeks to identify and leverage undervalued opportunities. The model selects the Top 100 Value stocks from the Nifty 500 universe, maintaining an equal-weighted portfolio.
The NJ Traditional Value model incorporates a broader range of valuation factors to assess a stock’s relative valuation. It evaluates companies based on Earnings to Price (EP), relative valuation through the ratio of Average 5-Year PE to Current PE, Free Cash Flow to Firm (FCFF) relative to Enterprise Value (EV), Book Value to Price, Forecasted EPS Growth in relation to PE, and Dividend Yield. By incorporating multiple valuation metrics, this methodology enhances the ability to identify fundamentally strong value stocks. The model selects the Top 100 Value stocks from the Nifty 500 universe with an equal-weighted portfolio.
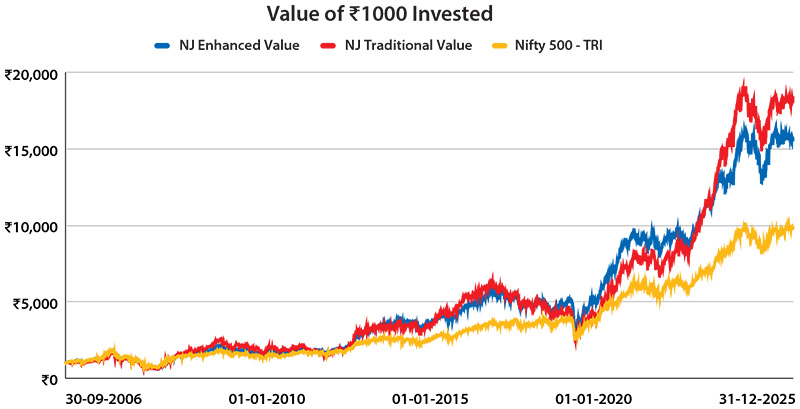
Source: Internal research, Bloomberg, CMIE, National Stock Exchange, NJ’s Smart Beta Platform (in-house proprietary model of NJAMC). Calculations are for the period 30th September 2006 to 31st December 2025. NJ Traditional Value Model and NJ Enhanced Value Model are in-house proprietary methodologies developed by NJ Asset Management Private Limited. The methodologies will keep evolving with new insight based on the ongoing research and will be updated accordingly from time to time. Past performance may or may not be sustained in future and is not an indication of future return. The above is only for illustration purposes and should not be construed as indicative return of offering of NJ Asset Management Private Limited.
The models display the following characteristics vis-a-vis the benchmark Nifty 500 TRI.
| |
P/E |
Dividend Yield |
EV to EBIT |
P/BV |
| NJ Enhanced Value |
25.92 |
0.33 |
22.99 |
4.91 |
| NJ Traditional Value |
17.25 |
1.57 |
19.34 |
2.52 |
| Nifty 500 TRI |
24.45 |
1.15 |
32.39 |
3.71 |
Source : Internal research, CMIE, National Stock Exchange of India, NJ’s Smart Beta Platform (in-house proprietary model of NJAMC). Factor parameters calculated as on 31st December 2025. For Nifty 500 TRI, the data for P/E, Dividend Yield and P/BV is taken from the official website of the National Stock Exchange of India. For NJ Traditional Value Model and NJ Enhanced Value Model all the parameters are calculated as weighted harmonic mean of its constituents. Past performance may or may not be sustained in future and is not an indication of future return. Outliers are not considered while calculating the numbers. Companies with negative EBIT and lending companies are not considered for EV to EBIT. NJ Traditional Value Model and NJ Enhanced Value Model are proprietary methodologies developed by NJ Asset Management Private Limited. The methodologies will keep evolving with new insight based on the ongoing research and will be updated accordingly from time to time.
Period-wise Performance of NJ Value Portfolios and Nifty 500 TRI
| Period |
NJ Enhanced Value (%) |
NJ Traditional Value (%) |
Nifty 500 TRI (%) |
| Sep 30, 2006 - Dec 31, 2012 |
11.18 |
12.64 |
8.95 |
| Jan 1, 2013 - Dec 31, 2018 |
16.57 |
15.15 |
12.75 |
| Jan 1, 2019 - Dec 31, 2025 |
18.06 |
20.55 |
15.81 |
| Entire Period |
15.37 |
16.33 |
12.65 |
Source : Internal research, CMIE, National Stock Exchange, NJ’s Smart Beta Platform (in-house proprietary model of NJAMC). Return calculations are based on CAGR (Compound Annual Growth Rate) for each period. NJ Traditional Value Model and NJ Enhanced Value Model are in-house proprietary methodologies developed by NJ Asset Management Private Limited. The methodologies will keep evolving with new insight based on the ongoing research and will be updated accordingly from time to time. Past performance may or may not be sustained in future and is not an indication of future return. The above is only for illustration purposes and should not be construed as indicative return of offering of NJ Asset Management Private Limited.
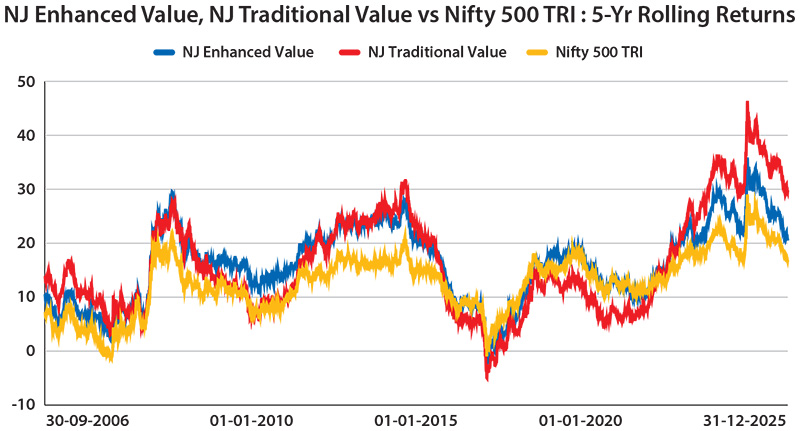
Source : Internal research, Bloomberg, CMIE, National Stock Exchange of India, NJ’s Smart Beta Platform (in-house proprietary model of NJAMC). 5-Yr CAGRs are calculated for the period 30th September 2006 to 31st December 2025 and have been rolled on a daily basis. Past performance may or may not be sustained in future and is not indication of future return. NJ Enhanced Value Model and NJ Traditional Value Model are proprietary methodologies developed by NJ Asset Management Private Limited. The methodologies will keep evolving with new insight based on the ongoing research and will be updated accordingly from time to time.
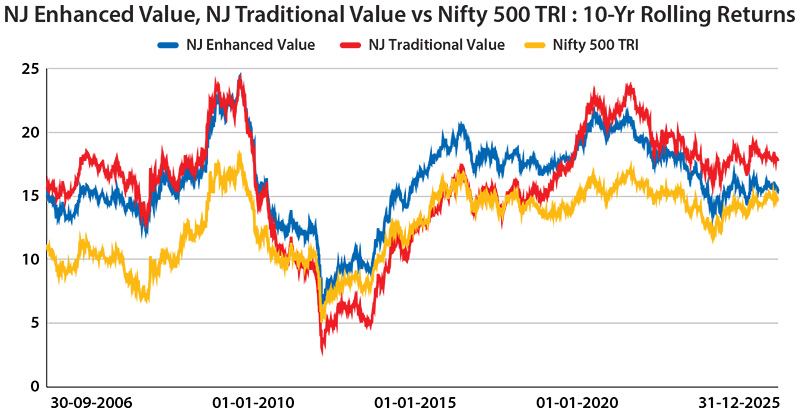
Source : Internal research, Bloomberg, CMIE, National Stock Exchange of India, NJ’s Smart Beta Platform (in-house proprietary model of NJAMC). 10-Yr CAGRs are calculated for the period 30th September 2006 to 31st December 2025 and have been rolled on a daily basis. Past performance may or may not be sustained in future and is not indication of future return. NJ Enhanced Value Model and NJ Traditional Value Model are proprietary methodologies developed by NJ Asset Management Private Limited. The methodologies will keep evolving with new insight based on the ongoing research and will be updated accordingly from time to time.
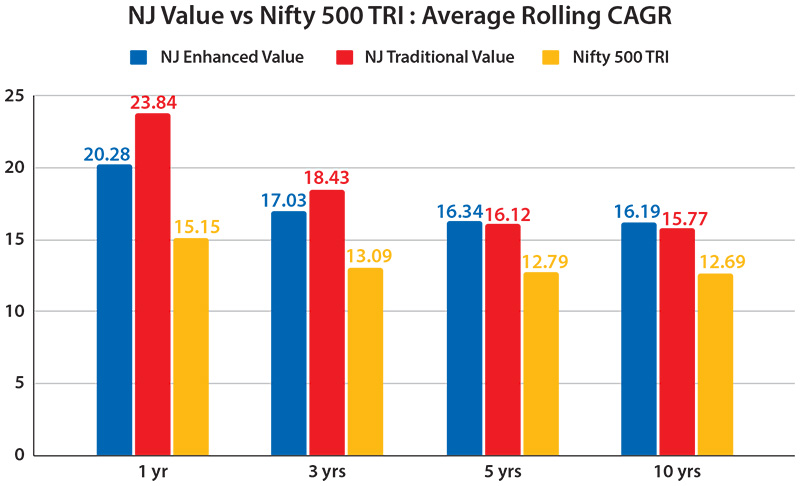
Source: Internal research, Bloomberg, CMIE, National Stock Exchange of India. CAGRs are calculated as the average CAGR based on the rolling CAGRs (rolled daily) calculated for the respective holding periods i.e. 1, 3, 5, and 10-Yr rolling CAGRs. The period for calculation is 30th September 2006 to 31st December 2025. Past performance may or may not be sustained in future and is not an indication of future return. NJ Traditional Value Model & NJ Enhanced Value Model are proprietary methodologies developed by NJ Asset Management Private Limited. The methodologies will keep evolving with new insight based on the ongoing research and will be updated accordingly from time to time.
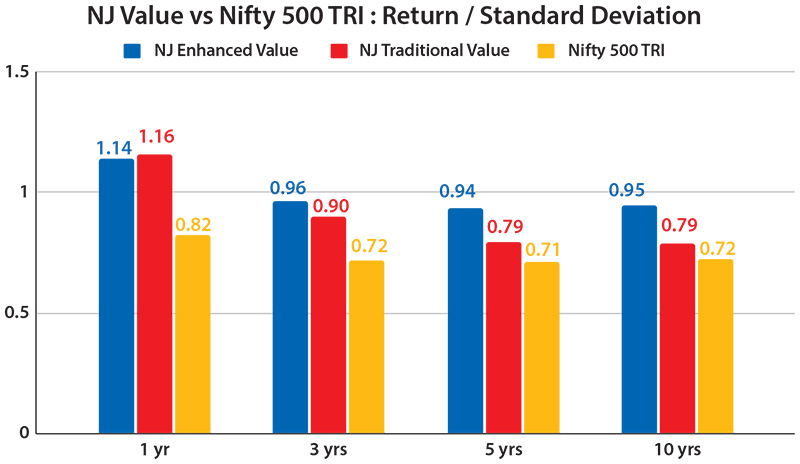
Source: Internal research, Bloomberg, CMIE, National Stock Exchange of India. The Return/Standard Deviation ratios have been calculated by dividing the respective rolling returns (rolled daily) by the standard deviation of the corresponding rolling returns, calculated over the period 30th September 2006 to 31st December 2025. Past performance may or may not be sustained in future and is not an indication of future return. NJ Traditional Value Model and NJ Enhanced Value Model are proprietary methodology developed by NJ Asset Management Private Limited. The methodologies will keep evolving with new insights based on the ongoing research and will be updated accordingly from time to time.
| |
NJ Enhanced Value |
NJ Traditional Value |
Nifty 500 TRI |
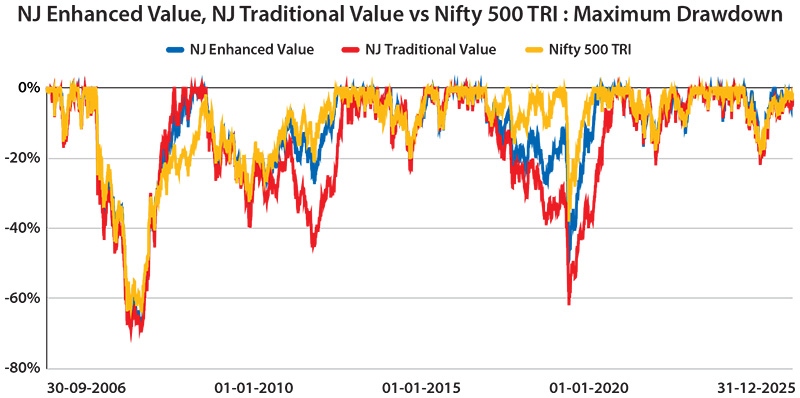
| Maximum Drawdown |
-68.34% |
-69.35% |
-63.71% |
Source: Internal research, Bloomberg, CMIE, National Stock Exchange of India, NJ’s Smart Beta Platform (in-house proprietary model of NJAMC). Calculations are for the period 30th September 2006 to 31st December 2025. The Drawdown for a specific date has been calculated by dividing that day’s NAV of NJ Enhanced Value Model, NJ Traditional Value and Nifty 500 TRI by their peak NAVs up to that date, respectively. Past performance may or may not be sustained in future and is not an indication of future return. NJ Enhanced Value Model and NJ Traditional Value Model are proprietary methodologies developed by NJ Asset Management Private Limited. The methodologies will keep evolving with new insight based on the ongoing research and will be updated accordingly from time to time.