Source: Internal research, Bloomberg, CMIE, National Stock Exchange, NJ’s Smart Beta Platform (in-house proprietary model of NJAMC). Factor parameters calculated as on 31st December 2025. For Nifty 500 TRI & NJ Low Volatility+ Model factor definitions are the average of its constituents. Volatility is calculated using daily returns annualised. Beta is calculated as the covariances of the security with the market divided by the variance of the market. Semi deviation is defined as downside standard deviation annualised. Past performance may or may not be sustained in future and is not an indication of future return. NJ Low Volatility+ Model is a proprietary methodology developed by NJ Asset Management Private Limited. The methodology will keep evolving with new insight based on the ongoing research and will be updated accordingly from time to time.
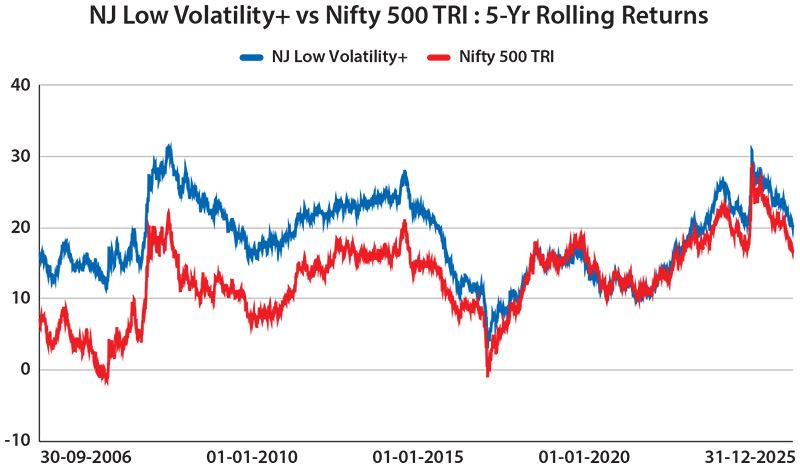
Source: Internal research, Bloomberg, CMIE, National Stock Exchange of India, NJ’s Smart Beta Platform (in-house proprietary model of NJAMC). 5-Yr CAGRs are calculated for the period 30th September 2006 to 31st December 2025 and have been rolled on a daily basis. Past performance may or may not be sustained in future and is not indication of future return. NJ Low Volatility+ Model is a proprietary methodology developed by NJ Asset Management Private Limited. The methodology will keep evolving with new insight based on the ongoing research and will be updated accordingly from time to time.
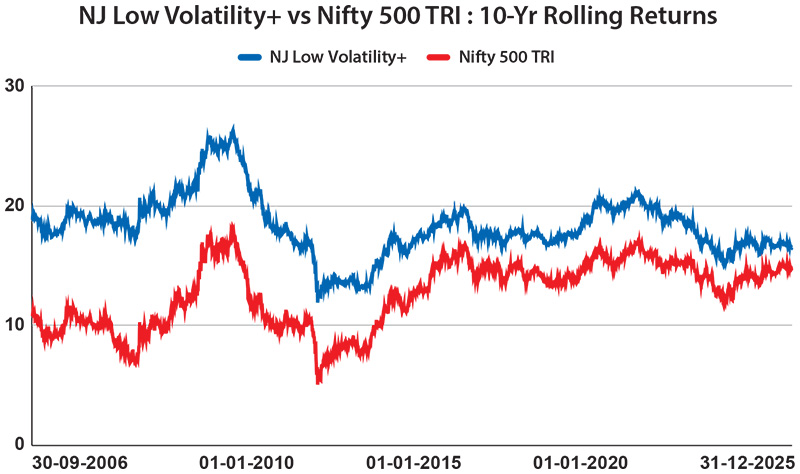
Source: Internal research, Bloomberg, CMIE, National Stock Exchange of India, NJ’s Smart Beta Platform (in-house proprietary model of NJAMC). 10-Yr CAGRs are calculated for the period 30th September 2006 to 31st December 2025 and have been rolled on a daily basis. Past performance may or may not be sustained in future and is not indication of future return. NJ Low Volatility+ Model is a proprietary methodology developed by NJ Asset Management Private Limited. The methodology will keep evolving with new insight based on the ongoing research and will be updated accordingly from time to time.
The low volatility factor lives up to its promise of generating additional returns compared to the index with lower deviation and greater consistency.
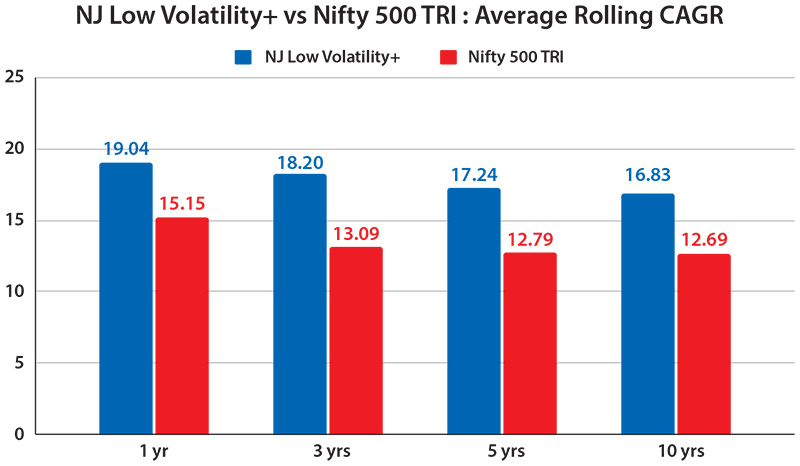
Source: Internal research, Bloomberg, CMIE, National Stock Exchange of India, NJ’s Smart Beta Platform (in-house proprietary model of NJAMC). CAGRs are calculated as the average CAGR based on the rolling CAGRs (rolled daily) calculated for the respective holding periods i.e. 1, 3, 5, and 10-Yr rolling CAGRs. The period for calculation is 30th September 2006 to 31st December 2025. Past performance may or may not be sustained in future and is not an indication of future return. NJ Low Volatility+ Model is a proprietary methodology developed by NJ Asset Management Private Limited. The methodology will keep evolving with new insight based on the ongoing research and will be updated accordingly from time to time.
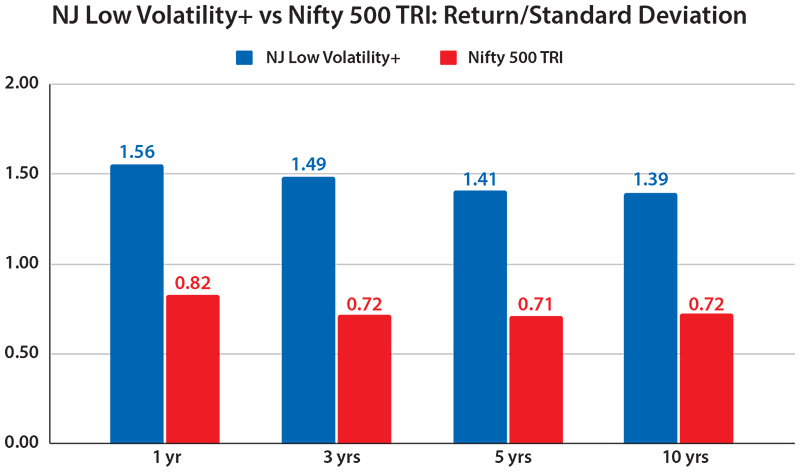
Source: Internal research, Bloomberg, CMIE, National Stock Exchange, National Stock Exchange of India, NJ’s Smart Beta Platform (in-house proprietary model of NJAMC). The Return/Standard Deviation ratios have been calculated by dividing the respective rolling returns (rolled daily) by the standard deviation of the corresponding rolling returns, calculated over the period 30th September 2006 to 31st December 2025. Past performance may or may not be sustained in future and is not an indication of future return. NJ Low Volatility+ Model is a proprietary methodology developed by NJ Asset Management Private Limited. The methodology will keep evolving with new insight based on the ongoing research and will be updated accordingly from time to time.
| |
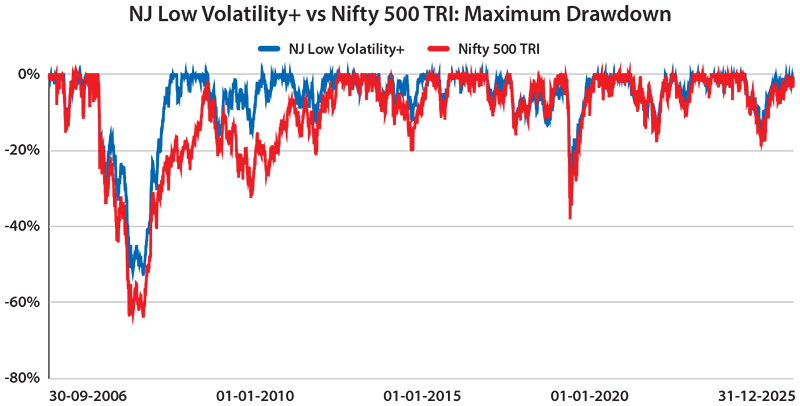
NJ Low Volatility+ |
Nifty 500 TRI |
| Maximum Drawdown |
-52.63% |
-63.71% |
Source: Internal research, Bloomberg, CMIE, National Stock Exchange. Data analysed from 30th September 2006 to 31st December 2025. The Drawdown for a specific date has been calculated by dividing that day’s NAV of NJ Low Volatility+ Model and Nifty 500 TRI by their peak NAVs up to that date, respectively. Past performance may or may not be sustained in future and is not an indication of future return. NJ Low Volatility+ Model is a proprietary methodology developed by NJ Asset Management Private Limited. The methodology will keep evolving with new insight based on the ongoing research and will be updated accordingly from time to time.